Meet the New Meta-Skills Dashboard
The Meta-Skills Data Insights Dashboard has been overhauled to give learning teams a clearer view of their organisation’s skills. The release combines a refreshed interface with richer insight into engagement, performance and improvement.
Connecting usage with performance
Completion rates show who participated, but they do not explain who improved or where further support is needed. The dashboard brings usage data and performance data together to help answer those questions.
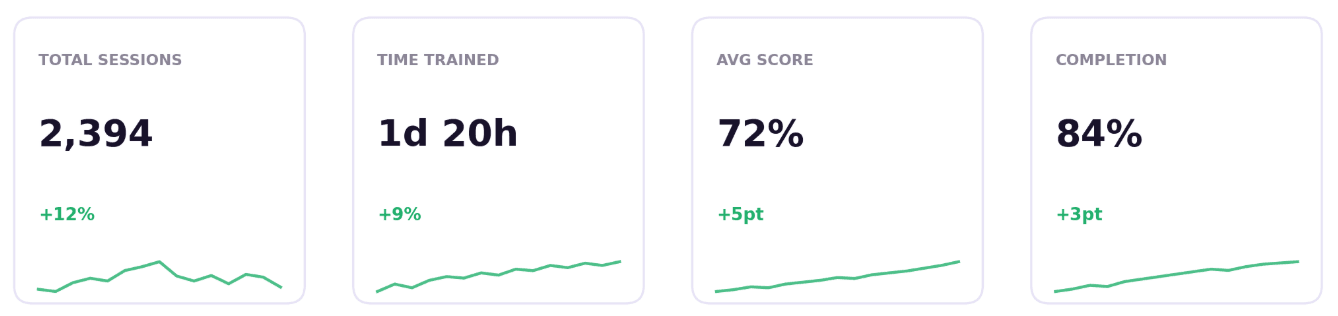
Sessions, time trained and completion show engagement across teams, countries, languages and departments, with trends over time. Average scores reveal how performance changes as learners repeat roleplays. Filters help teams compare cohorts, while exports make the results easier to share with stakeholders.
The purpose is to give L&D teams evidence they can use when discussing the value of training: who is practising, what is changing and where to focus next.
Looking inside each skill
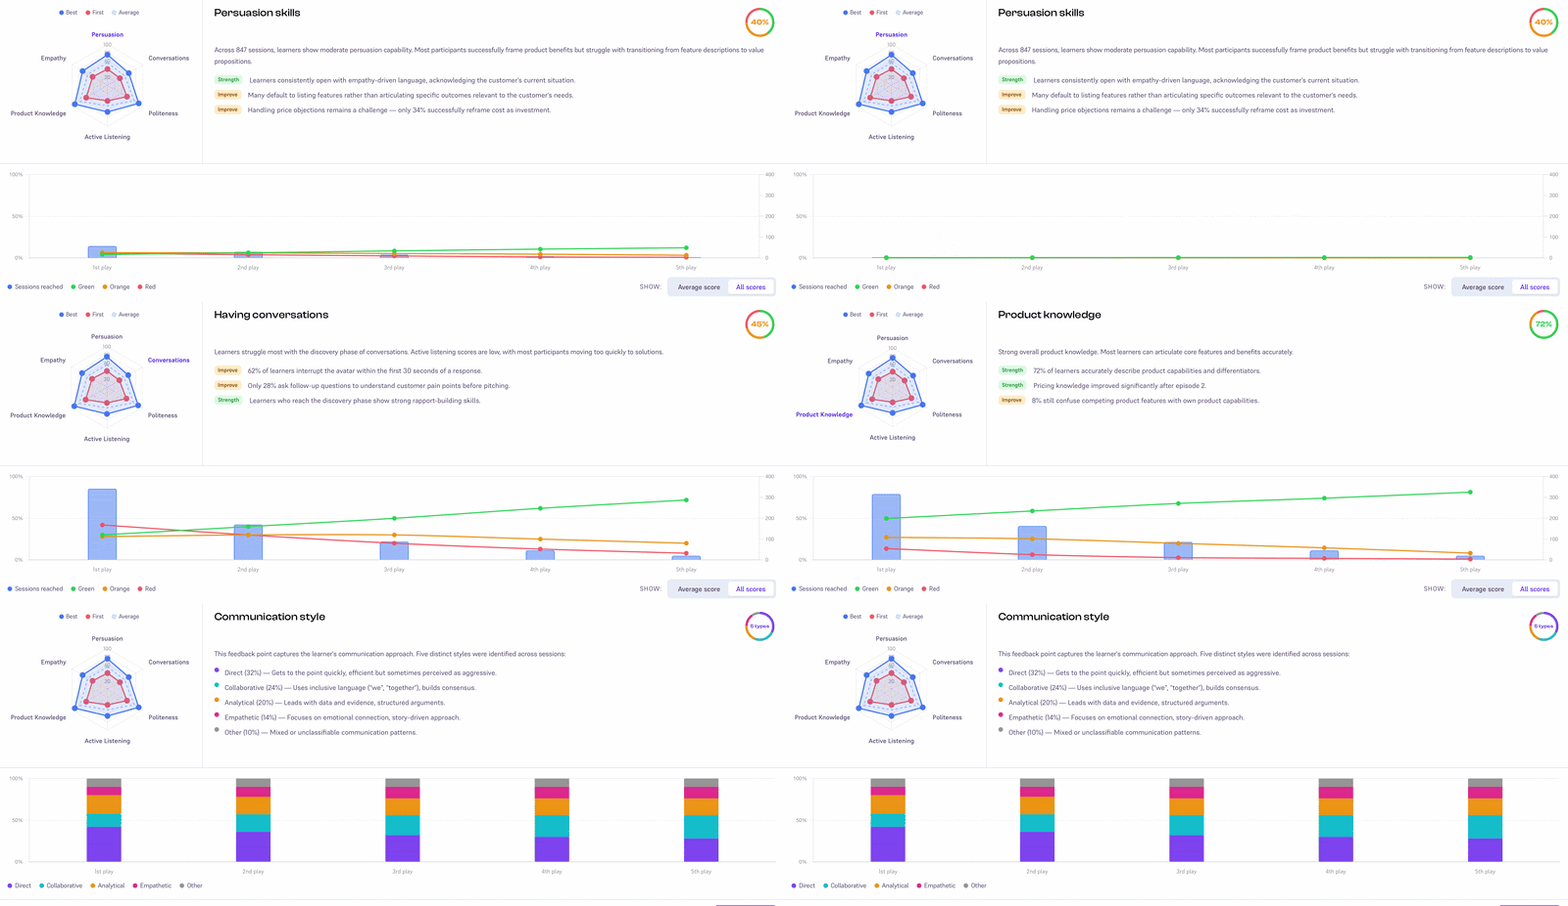
A skill such as objection handling brings together persuasion, active listening, product knowledge, empathy and other behaviours. The new dashboard makes those elements visible through quantitative scoring and qualitative insights.
For example, the release illustrated a pattern in which learners opened with empathy but only 34% successfully reframed a price objection as an investment. That is an example of the kind of specific coaching target the dashboard can surface, rather than a benchmark for every team.
Seeing progress through repetition
Personalised feedback gives learners something concrete to work on after each attempt. Repetition tracking makes the resulting performance curve visible, helping managers see how practice develops over time.
Starting, best and average scores offer different views of performance. Progress trends and skill-gap detection help managers identify the elements that need attention, while qualitative observations support more focused coaching conversations.
An interface built for insight
The release brings granular skill scoring, usage and performance data, cohort comparisons and repetition tracking into one clearer interface. Managers and L&D teams can move from a broad overview to the details they need to support learners.